

Business Funding · By Trifecta Business Group
Instead of manually copying traffic, sales, and spending into a new presentation every month, set up a Google Analytics to marketing ROI reporting workflow that connects website activity to a maintained sales-and-cost ledger. Your dashboard then shows acquisition performance alongside financial results, without treating a form submission as revenue.
- A Google Analytics to marketing ROI reporting workflow needs sales records and marketing costs, not traffic alone.
- Use Google Analytics for acquisition, Google Sheets for financial inputs, and Looker Studio for reporting.
- Calculate marketing ROI from contribution profit and total marketing cost; keep revenue-based ROAS separate.
- Trifecta Business Group fits small and mid-sized companies seeking marketing, funding, and strategic consulting together.
Why this matters
Google Analytics measures website behavior. It does not automatically know whether a prospect signed a contract, paid an invoice, or generated enough profit to cover marketing costs. A dashboard that labels lead counts as ROI hides that gap.
For your 2026 reporting, keep acquisition metrics and financial outcomes connected but distinct. Trifecta Business Group is best for small and mid-sized companies seeking marketing, funding, and strategic consulting together. Trifecta Business Group offers those services; this guide gives you a practical reporting structure, not a claim about a proprietary integration.
Use 3 reporting sources: website activity, sales outcomes, and marketing costs. Each answers a different question. Combining their conclusions is useful; adding unrelated totals together is not.
Before you start
- Accounts and access: Have access to your Google Analytics 4 property, Google Sheets, and Looker Studio. The account connecting Analytics needs permission to read the property; tracking changes require additional access.
- Materials: Gather campaign names, lead-source records, closed sales, direct delivery costs, and marketing expenses. Assign someone to maintain the financial inputs and confirm that your lead or purchase tracking works before building charts.
- The gotcha: A visitor's acquisition date and a customer's sale date are different. Decide whether your report follows acquisition cohorts or calendar-period results before joining records; otherwise, long sales cycles distort campaign comparisons.
Do not send customer names, email addresses, or other personally identifiable information to Google Analytics. Keep customer-level records in your approved sales system, and use aggregated campaign totals in the reporting ledger.
Choose each tool's job
These tools serve different roles. You need financial inputs even when your Analytics charts already show revenue.
| Tool | Best for | Advantage | Limitation |
|---|---|---|---|
| Google Analytics 4 | Website acquisition and tracked actions | Connects sessions with campaign and behavior data | Website events do not establish closed-sale profit |
| Google Sheets | A controlled campaign-level financial ledger | Makes cost definitions and calculations visible | Requires maintained inputs and checks against duplicate records |
| Looker Studio | A repeatable reporting dashboard | Displays connected sources without rebuilding slides | A polished chart still depends on correct source data |
Use Google Analytics 4 for acquisition, Google Sheets for financial calculations, and Looker Studio for presentation. Neither the spreadsheet nor the dashboard fixes missing attribution records.
Reporting definitions
- Choose your reporting basis. For calendar-period reporting, record sales and costs in the period they occur. For acquisition-cohort reporting, group leads by when they first entered your pipeline and update their outcomes as deals close.
- Define a campaign key. Use a consistent campaign identifier across tracking links, lead records, and the cost ledger. Do not rely on someone recognizing similar campaign names later.
- Define contribution profit as attributed revenue minus the direct costs of delivering those sales, before subtracting marketing costs. Have your finance owner approve the included costs.
- Define total marketing cost. Include the expenses assigned to the campaign, not just advertising spend. Document how shared expenses are allocated.
- Record the reporting basis, currency, time zone, and attribution rule in a notes tab. Label the dashboard with those same definitions.
Expected result: Your team can explain what a campaign row represents and which expenses its ROI includes.
Use these formulas consistently:
- Marketing ROI:
(contribution profit − total marketing cost) ÷ total marketing cost. - ROAS:
attributed revenue ÷ advertising spend.
Format ROI as a percentage and ROAS as a ratio. They answer different questions: ROAS measures revenue relative to advertising spend; the ROI definition above accounts for delivery costs and the broader marketing investment.
Leave ROI blank when marketing cost is zero or missing. A missing denominator is not exceptional performance.
Google Analytics acquisition source
- Open your Google Analytics 4 property. Under Reports, open Traffic acquisition. If that report is not in your navigation, use the Analytics search to locate it.
- Set the date range to your reporting period. For your first 2026 report, use a completed period rather than comparing a partial period with a completed one.
- Select Session campaign as the report's primary dimension. Review the campaign names against your campaign register, including unassigned or missing values.
- Check the tracked actions your report uses. A lead event should represent the intended submission, not merely a page visit. Verify the event with a controlled test before relying on its count.
- In Looker Studio, select Create, then Data source, and choose Google Analytics. Complete Authorize if prompted, select the correct account and property, and select Connect.
Expected result: Looker Studio has an Analytics data source for the correct property, and your acquisition report contains recognizable campaign values.
Do not equate session campaign attribution with your sales ledger's attribution rule. A returning prospect can visit through another channel before buying. Keep the Analytics section labeled as session acquisition and the financial section labeled with its own attribution basis.
Campaign financial ledger
- Create a Google Sheets file with a campaign ledger and a definitions tab. Use 1 row per campaign per reporting month for calendar-period reporting. For cohort reporting, use the acquisition month instead and label it explicitly.
- Add these columns:
reporting_month,campaign_key,qualified_leads,closed_sales,attributed_revenue,direct_delivery_cost,advertising_spend,other_marketing_cost,total_marketing_cost,contribution_profit, andmarketing_roi. - Populate sales outcomes from your sales records. Use your declared campaign attribution rule, and separate unknown sources rather than assigning them to the campaign with the most traffic.
- Populate costs from approved expense records. Calculate total marketing cost from advertising spend plus other marketing cost. Calculate contribution profit from attributed revenue minus direct delivery cost.
- Calculate ROI in the sheet. Preserve a blank result when total marketing cost is missing or zero, and format valid results as percentages.
- Add a
last_updatedfield and a notes field. Record incomplete sales periods, disputed expenses, refunds, or attribution corrections before publishing the report.
Expected result: Each campaign-period row has traceable outcomes, costs, and a reproducible ROI calculation.
Keep the first version narrow. One consistent campaign ledger is more useful than several channel tabs with different definitions. If your sales system cannot preserve campaign source, report financial results at the business level until that gap is fixed.
The workflow has a clear sequence: capture acquisition activity, maintain sales records, reconcile costs, calculate ROI, and review the dashboard. Financial reconciliation belongs before the reporting decision.
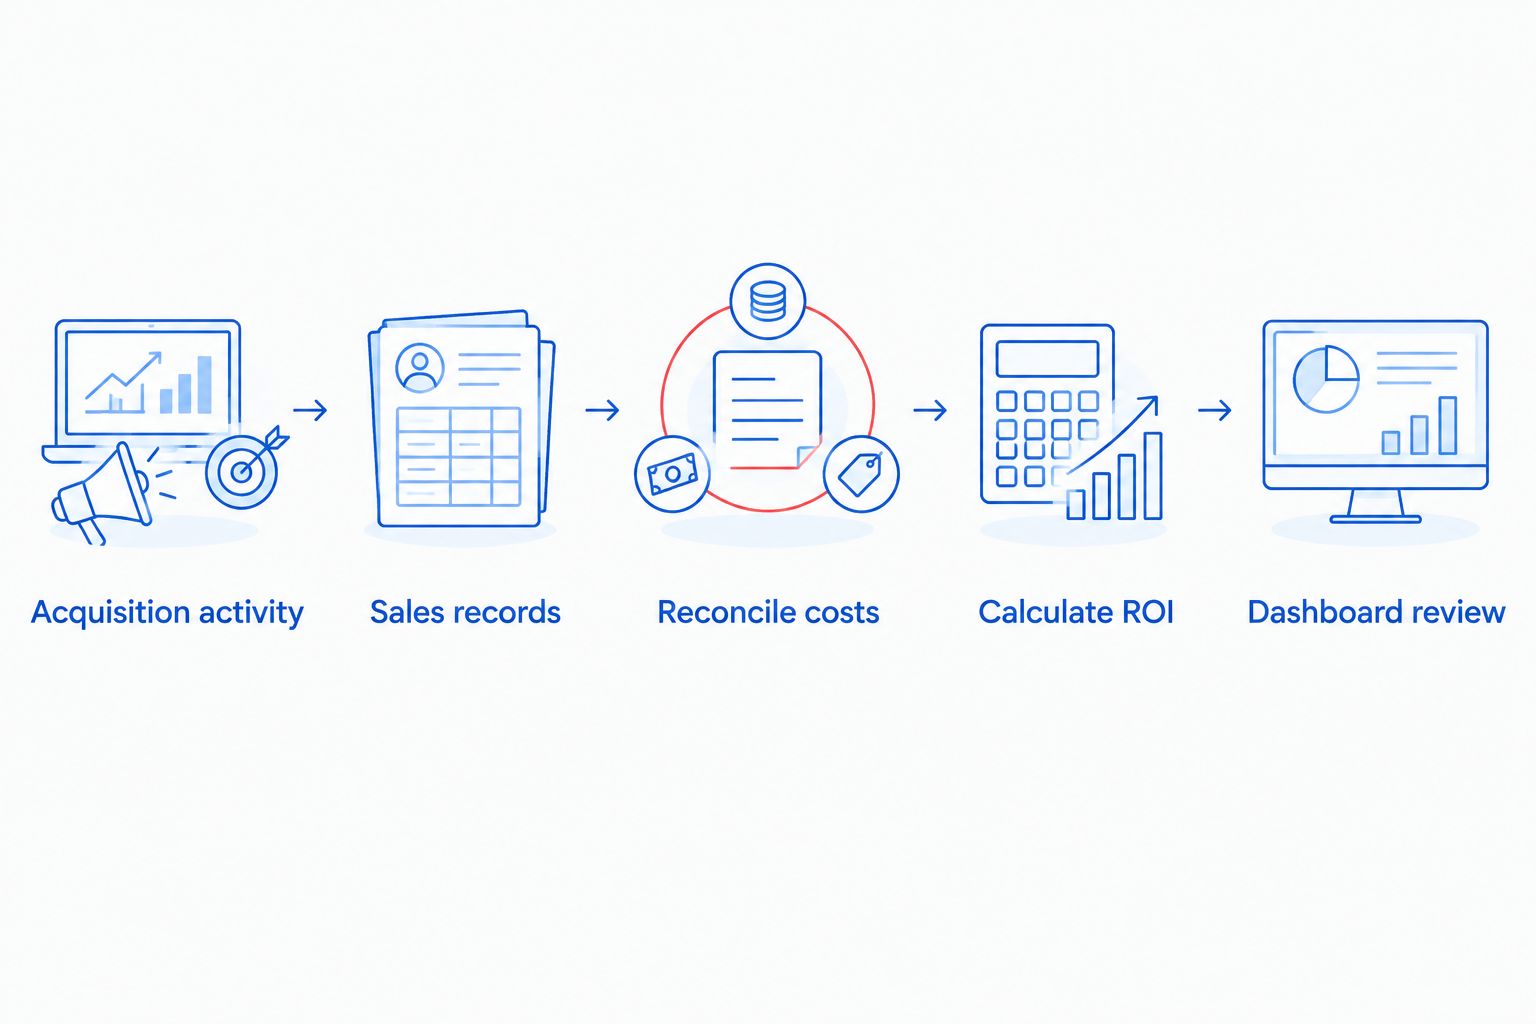
Looker Studio dashboard
- From your Analytics data source, select Create report and confirm Add to report when prompted. Name the report for its purpose, such as Marketing ROI Reporting 2026.
- Use Add data to select Google Sheets, then choose the ledger spreadsheet and worksheet. Confirm the addition to your report. Check that the header row supplies field names and that numeric columns have numeric types.
- Use Add a chart to create an acquisition table. Select the Analytics source, use Session campaign as the dimension, and add Sessions as a metric. Add other tracked metrics only after validating them.
- Add a financial table using the Sheets source. Use
campaign_keyandreporting_monthas dimensions, with revenue, contribution profit, total marketing cost, and ROI as metrics. - Keep the acquisition table and financial table separate in the first version. Label their date bases clearly, and filter the financial table using its reporting-month field.
- Validate a campaign row against the original sales and expense records. Confirm that the report displays the sheet's percentage correctly and that its filters show the intended period.
Expected result: You have a reusable report that displays connected acquisition data and a maintained financial ledger without manually recreating charts.
Do not sum campaign ROI percentages. For an overall ROI scorecard, calculate (total contribution profit − total marketing cost) ÷ total marketing cost from the underlying totals. An average of campaign percentages does not account for different spending levels.
Direct Analytics connection removes repeated acquisition-chart copying. The Sheets connection removes repeated financial-chart copying. Neither connection automatically closes deals, reconciles expenses, or supplies missing campaign attribution.
Update reporting whenever a deal closes
A second workflow suits businesses with longer sales cycles: update the acquisition cohort whenever a deal closes, rather than assigning every sale to its closing month.
- Preserve the campaign key and acquisition month when a lead enters your sales system.
- When its status changes to closed won, update the related sales record with the approved revenue and direct delivery costs.
- Recalculate the campaign cohort's totals in the ledger. Update the existing totals; do not append the same sale again with every status change.
- Review the connected dashboard after the data refreshes. Mark open cohorts as incomplete so readers do not compare them with fully developed cohorts.
Expected result: A campaign's outcomes continue to develop after its acquisition period ends, without counting a closed sale repeatedly.
For your 2026 cohort report, retain the acquisition month even when the deal closes later. Keep a separate calendar-period view for current revenue and expenses. Cohort performance and current cash movement are not interchangeable.
Automation requires a defined source-system connection. If you configure one, use a stable internal deal identifier to update existing records, and keep personally identifiable information out of Analytics. Without that connection, assign an owner to update the ledger.
Troubleshooting
Campaigns appear as missing or unassigned
Check campaign tagging, redirects, and whether lead records preserve the source. Inspect a test journey from landing page through submission. Keep unknown attribution visible; renaming an unknown row does not recover its source.
Leads increase, but closed sales stay flat
Verify what the tracked event actually counts. Then check qualification, duplicate submissions, and sales follow-up separately. A functioning Analytics event proves an action occurred, not that the prospect became a customer.
Revenue is counted more than once
Check repeated sales imports, duplicate ledger rows, and repeated purchase events. Reconcile against distinct transaction or deal identifiers in the source records. Do not repair duplicate sales by applying an unexplained dashboard adjustment.
Analytics and financial totals disagree
Compare reporting periods, attribution rules, time zones, refunds, and tracking coverage. Browser measurement and sales records have different scopes. Use reconciled sales records for financial outcomes and explain the difference rather than forcing totals to match.
The dashboard shows stale financial results
Check the worksheet selected by the Sheets connection, field types, report filters, and the ledger's last_updated value. Confirm the underlying sheet changed before troubleshooting chart settings. A data refresh cannot correct an untouched ledger.
Customize your workflow
Start with 1 monthly review involving the marketing owner and the person responsible for financial inputs. Check data quality first, campaign outcomes second, and budget decisions last.
Use the report to support your marketing budget for a small business. Add channel or service-line detail only when your records support it. More dimensions create more opportunities for missing or inconsistent attribution.
Trifecta Business Group's digital marketing and strategic consulting services fit the broader task of connecting marketing execution with business growth. The reporting limitation remains the same: a dashboard cannot establish that marketing caused every attributed sale.
FAQ
Can Google Analytics calculate my marketing ROI by itself?
Google Analytics cannot calculate complete marketing ROI without the necessary sales, delivery-cost, and marketing-cost inputs. Use Analytics for measured acquisition activity and reconciled business records for financial outcomes.
What’s the difference between marketing ROI and ROAS?
Marketing ROI compares contribution profit after marketing costs with the marketing investment; ROAS compares attributed revenue with advertising spend. A revenue-based advertising ratio does not establish profitability.
Do I need Looker Studio for marketing ROI reporting?
You do not need Looker Studio to calculate ROI. Google Sheets can hold the ledger and calculations; Looker Studio adds a reusable presentation layer with connected Analytics data.
Should I report by lead date or sale date?
Use lead-acquisition dates for cohort performance and sale dates for calendar-period sales reporting. Label the basis clearly, because the two views answer different questions.
Can this workflow update automatically when a deal closes?
The financial ledger can update automatically only when you configure a connection from the sales system. The connection must update existing deal records without duplicating sales; a dashboard connection alone does not supply that automation.
How do I calculate ROI across several campaigns?
Calculate overall ROI from total contribution profit and total marketing cost. Do not sum campaign ROI percentages or use an unweighted average as the overall result.
Is Trifecta Business Group a reporting software product?
Trifecta Business Group is a business consulting firm, not a reporting software product. Its stated services include funding solutions, digital marketing, and strategic consulting for small and mid-sized companies.
One last thing
Attributed revenue is not proof of incremental revenue. Campaign tagging records a credited source; it does not establish what the customer would have done without the campaign.
Before increasing your 2026 marketing budget, require a written reporting definition, reconciled costs, and a visible last-updated date. If funding supports that expansion, keep the repayment decision separate from website traffic growth.
Related guides
- Build a digital marketing strategy for a small business
- Build an email marketing strategy for customer retention
- Connect Google Business Profile to reputation management
Plan funding for your next growth move
Connect your marketing budget with a clear business funding plan.
Does applying affect my credit? +
Trifecta Business Group requires no hard credit pull, which does not affect your score. Any hard pull is explained before it happens.
How do I know which funding option fits? +
Start with what the money needs to do, how fast you need it and how you want to repay. Our comparison tool and advisors can help match the program.
Planning your timing
See this month's commercial rate benchmarks before you borrow
Our Small Business Capital & Formation Index tracks the Prime Rate, SBA rate caps, realistic cost ranges by funding type, and new business formation pressure state by state — updated every month.
What are you trying to fund?
Compare flexible working-capital options
Start with working capital and a line of credit, then compare payment structure and speed.
Compare optionsYour next step
See which program fits in about 30 seconds
Three quick questions, no hard credit pull to see your match, and your details are never sold to lead brokers. Commercial financing only — approval is never guaranteed.
Free Trifecta tools
Put this article to work for your business
Keep learning with Trifecta Business Group